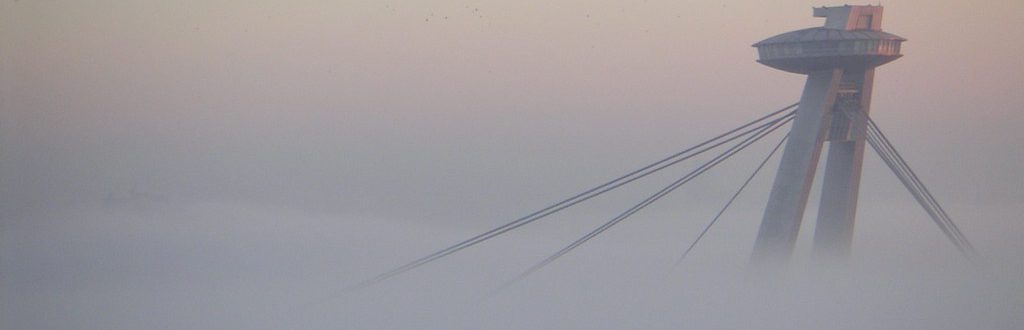
The photo used as an introductory illustration in the top section of the blog was photographed by Pavol Čavojský.
The most common temperature stratification during winter in the central Europe is an inversion – i.e. temperature of air increases with height. The best way to visualize these situations are vertical cross sections and thermodiagrams.
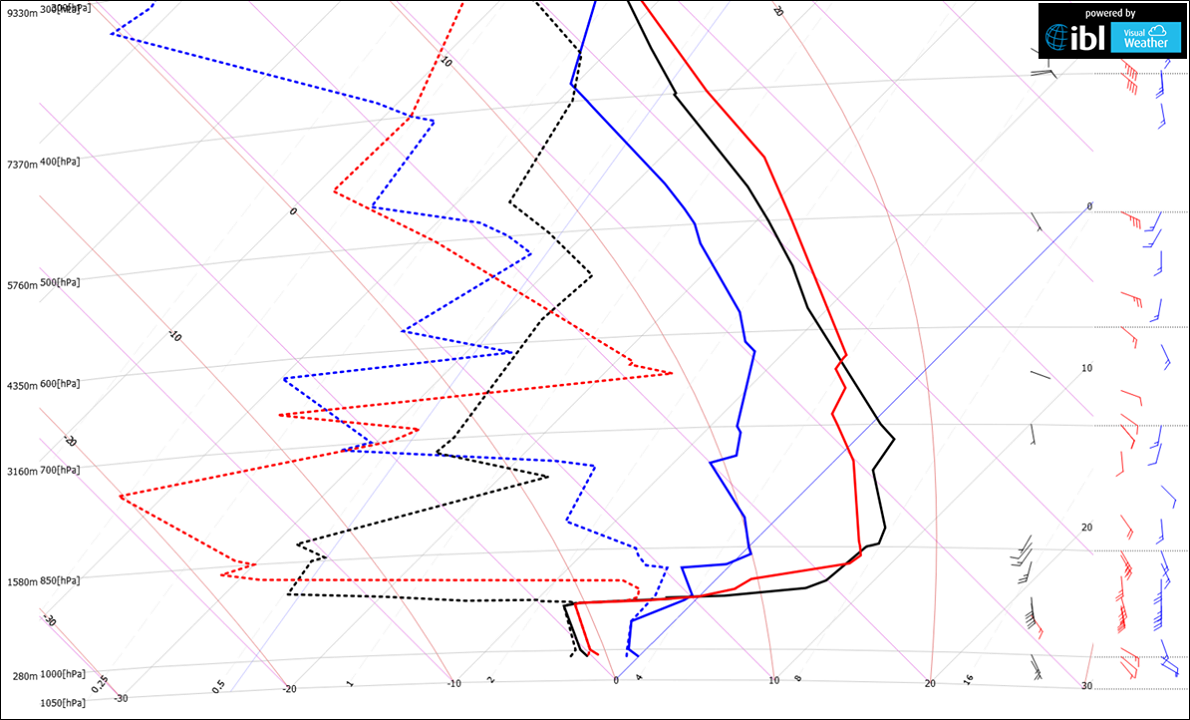
Figure 1 – Vertical change of temperature (solid line) and dew point (dashed line) in Wien on Dec 19th (blue), Dec 20th (red) and Dec 21st (black) at 12 UTC.
We can see from figure 1 that the inversion becomes stronger and stronger from December 19th to 21st over Wien. There is a huge vertical gradient on Dec 21 st – temperature increases from -7 to +7 dgC in only 200 m. Another typical feature is the rapid decrease of humidity just above cold air layer. This is because the warm air above cooler air acts like a lid, suppressing vertical mixing and trapping the cooler air along with the water vapor and air pollutants at the surface. Thus, the temperature inversion can lead to poor air quality, especially in urban areas. However, if you are above the cold air layer, you can enjoy beautiful clear sky and clouds reminding a sea – figure 2.
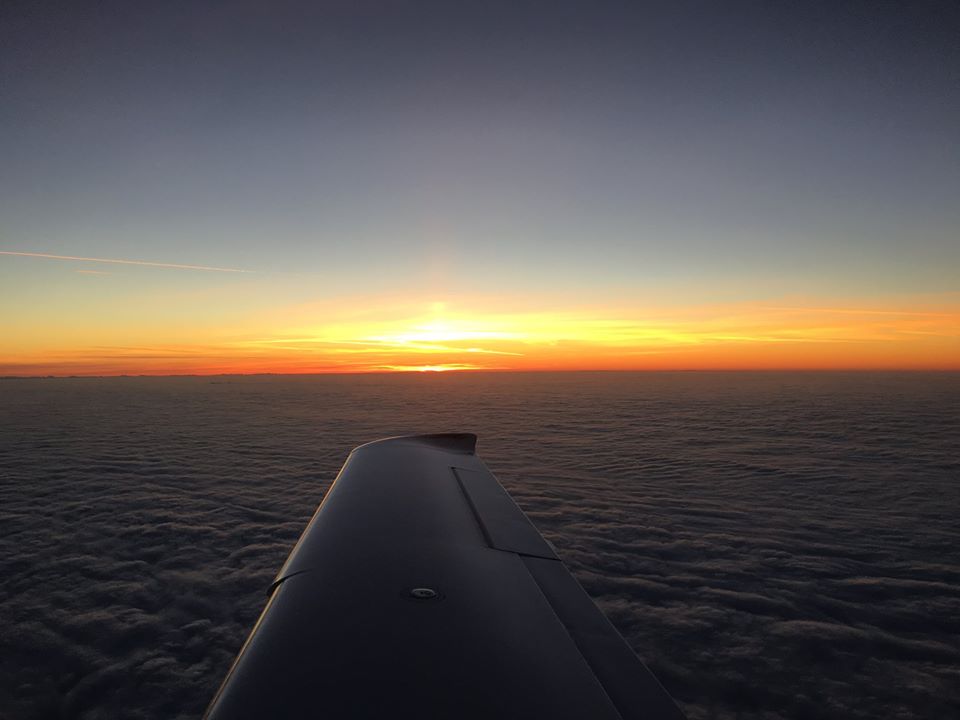
Figure 2 – Stratus cloud from above. Photographed by Milan Novanský.
Figure 3 shows vertical cross section of temperature and wind across Slovakia on the same day at noon. The inversion is more distinct in the southwest part of the country, probably because of cold air advection from the Balkan Peninsula.
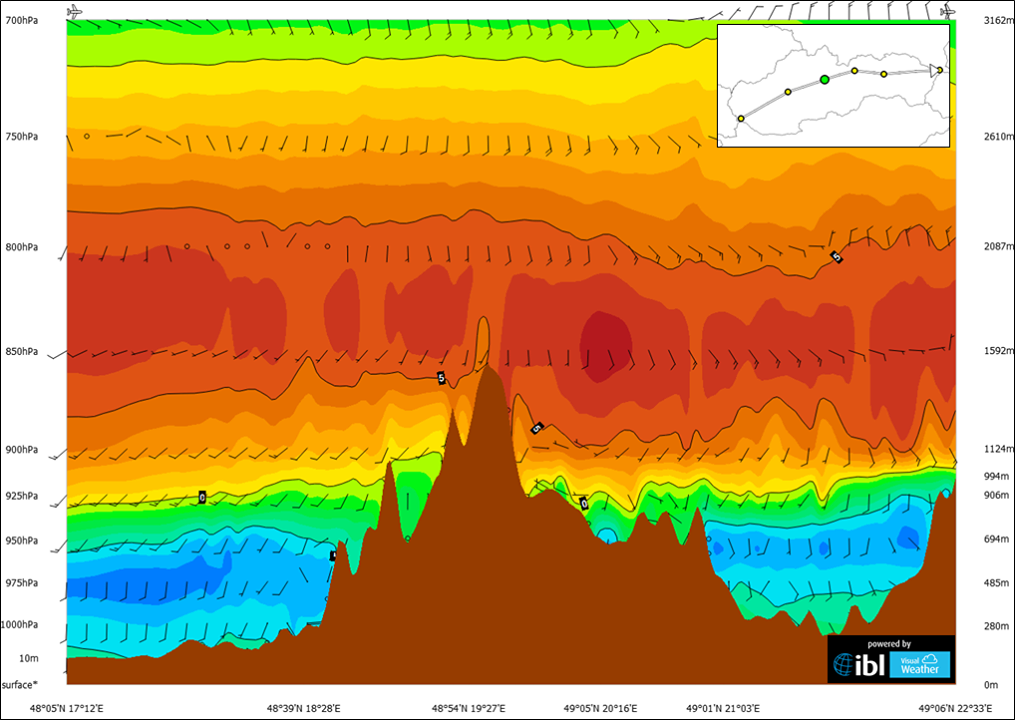
Figure 3 – Vertical cross section of temperature and wind field across Slovakia on December 22nd 00 UTC.
0 Comments Leave a comment