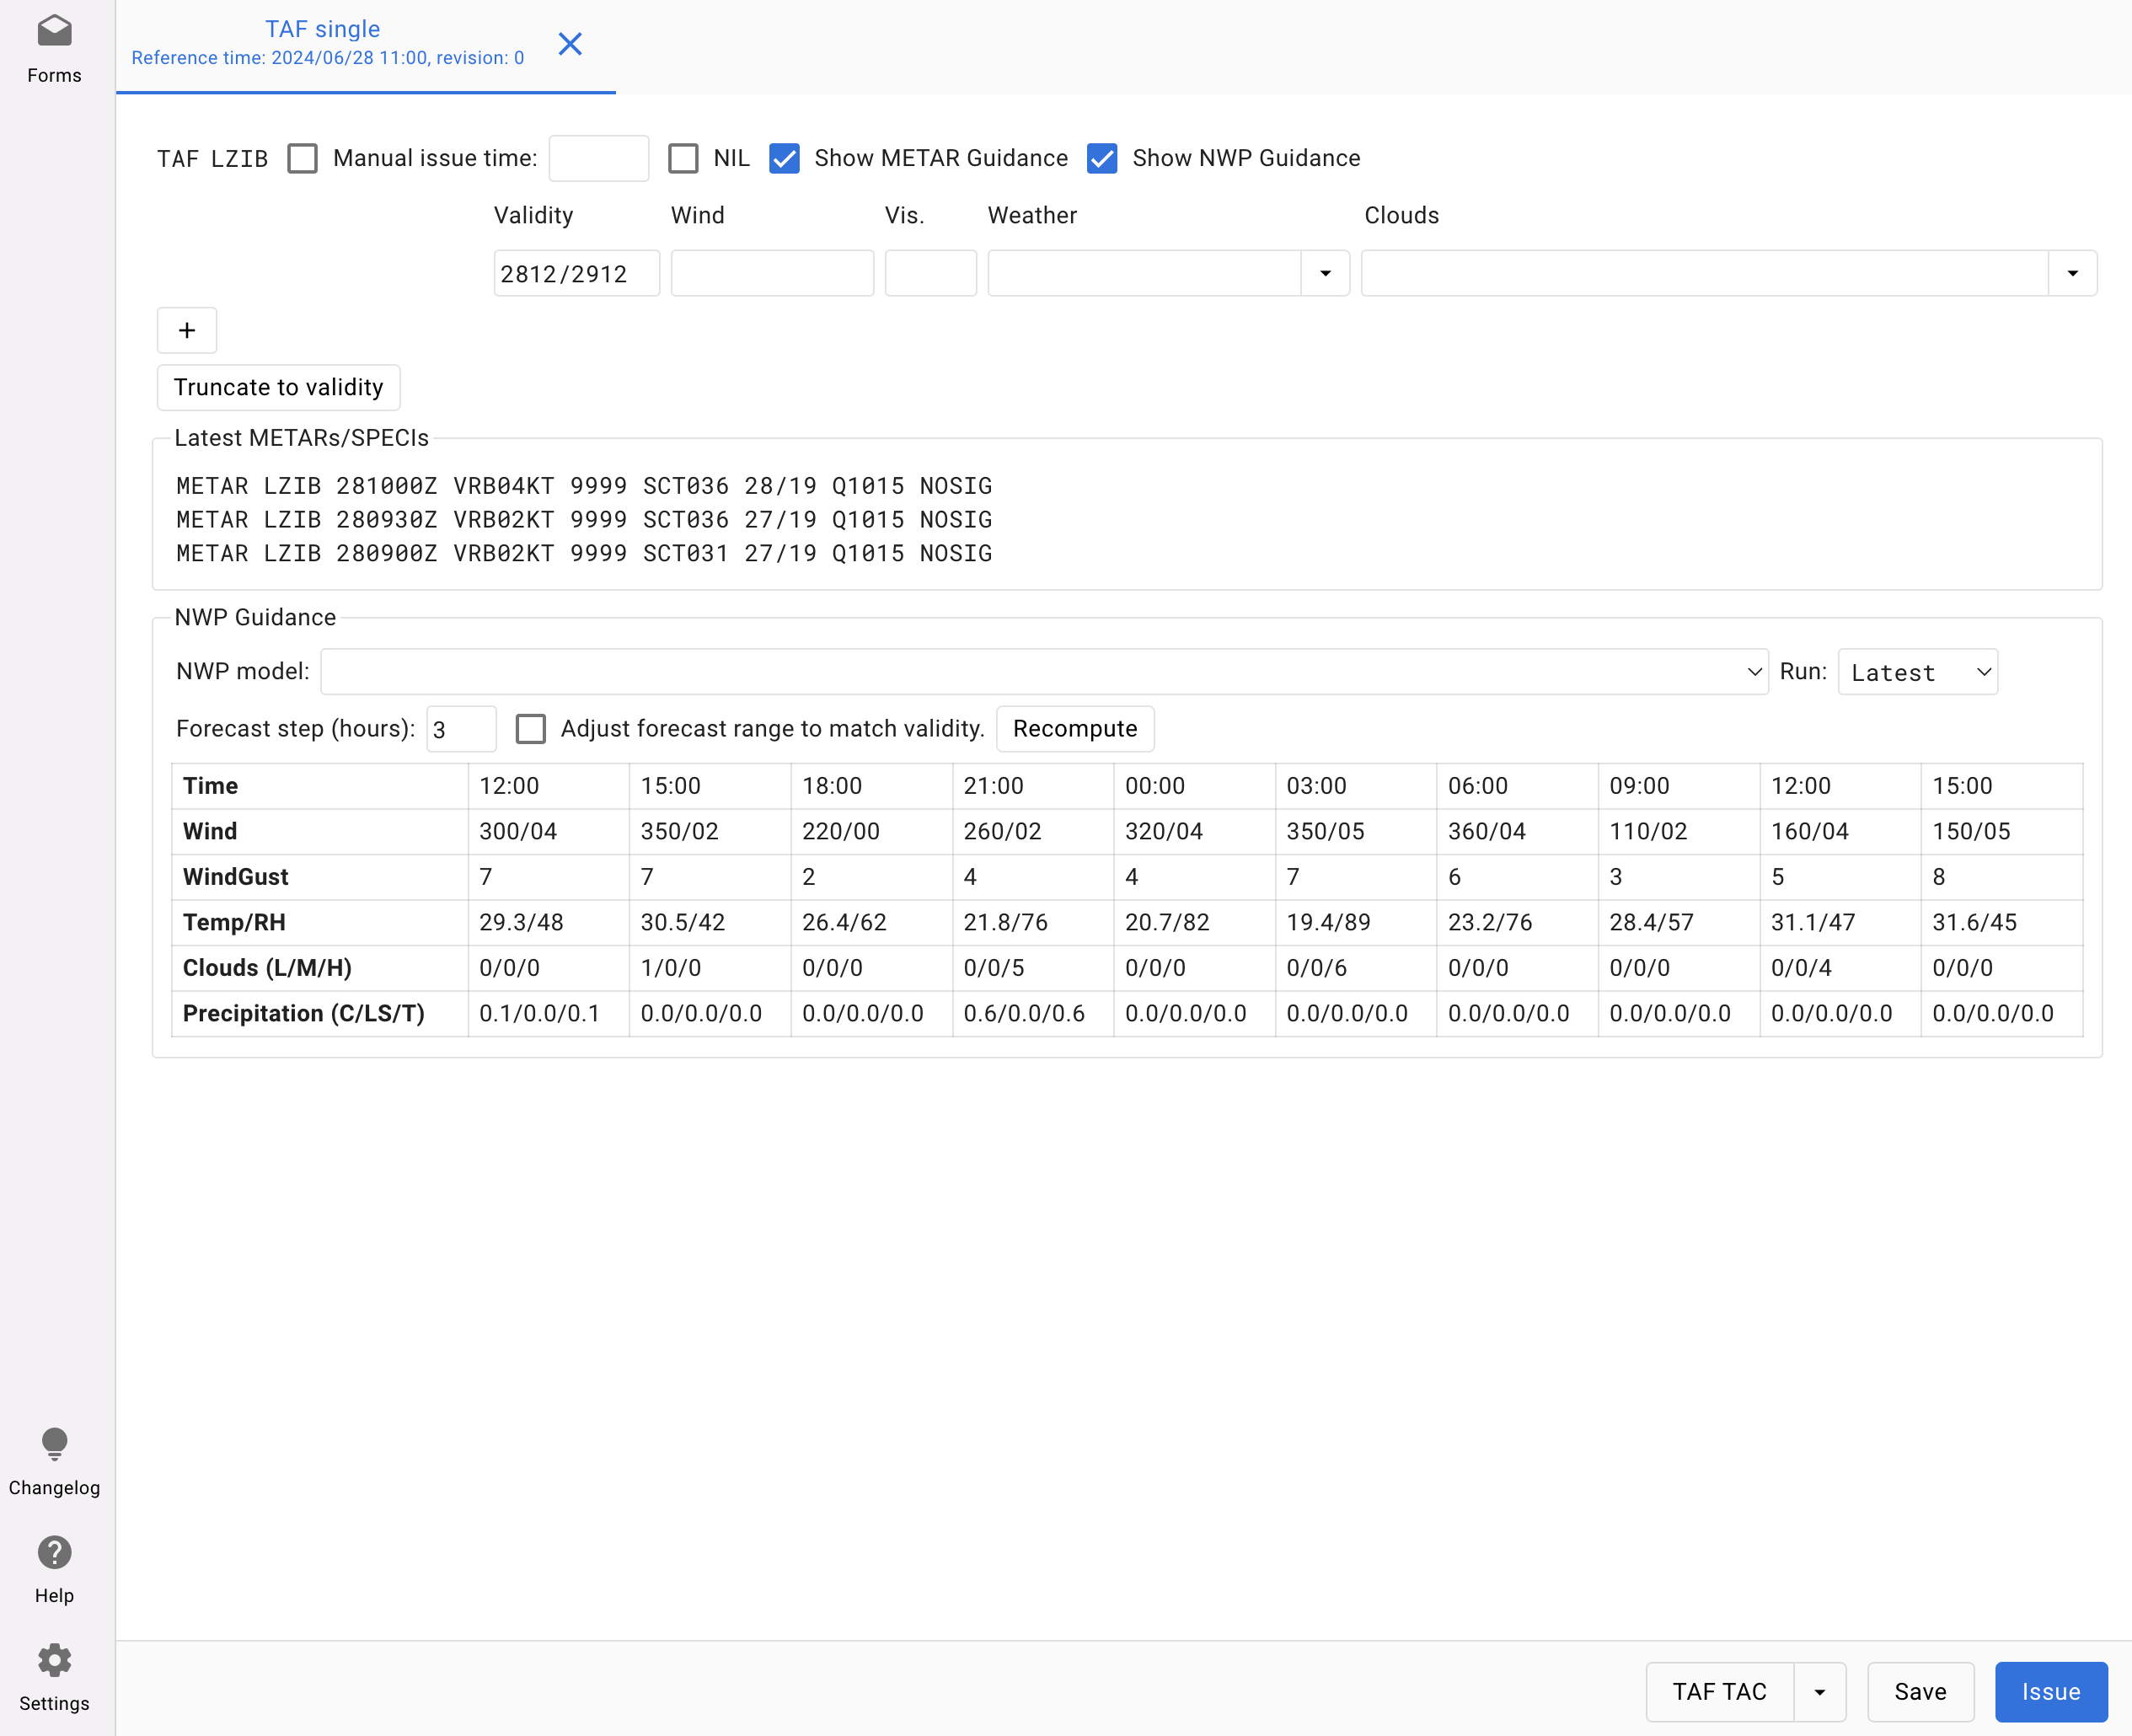
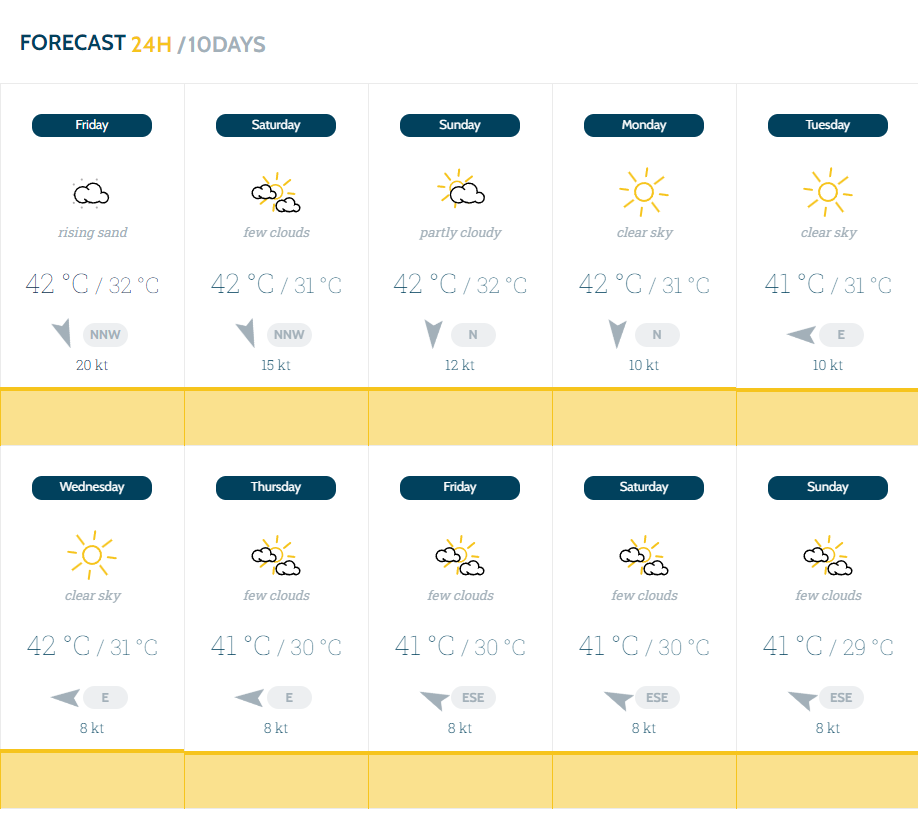
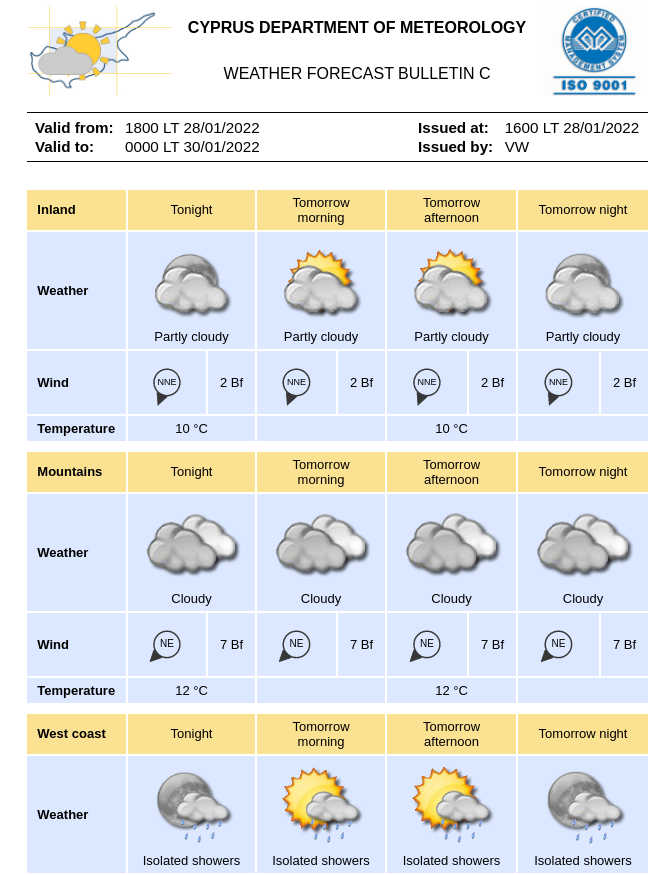
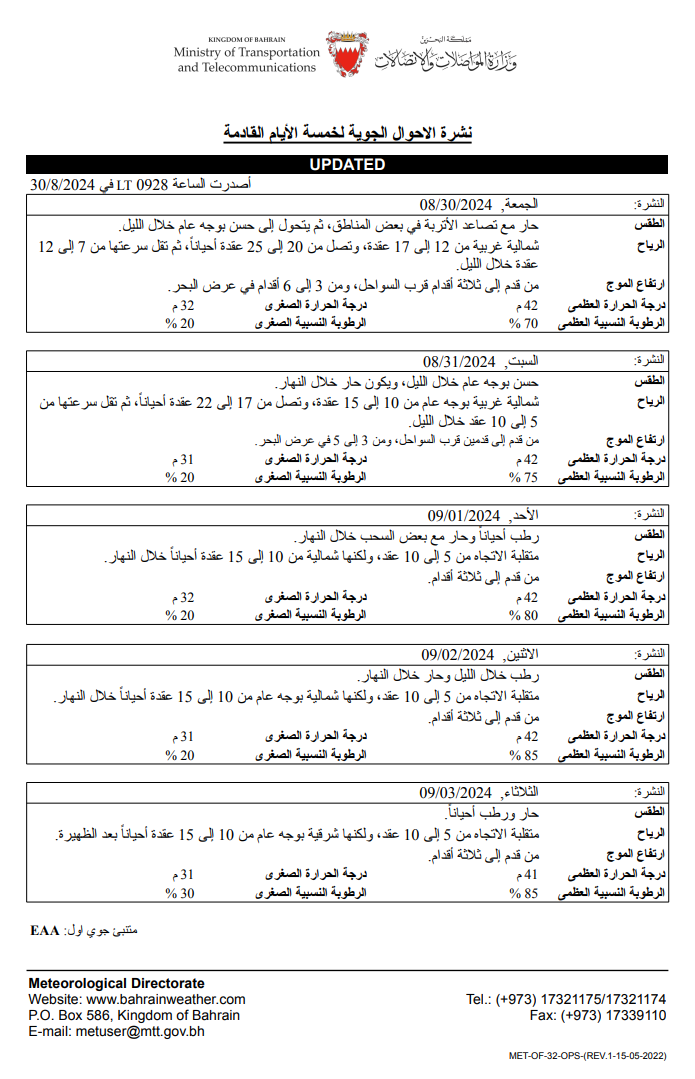
Online Weather

OpenGIS Web Services

Web Service module opens Visual Weather’s visualization and data processing capabilities to all Service-Oriented Architecture (SOA) frameworks. This concept allows Visual Weather users to create new demand-driven batch production mechanisms. Web Services build a bridge between Visual Weather and 3rd party systems in the following key areas:

  • Interfacing with other Geographical Information Systems (GIS) based on OpenGIS standard Web Service protocols.
  • Exposing custom data decoding, computing and post-processing functionality of Visual Weather to bespoke applications using Python API with XML, JSON, GeoJSON, CSV or any arbitrary output format.

Online Weather WMS used in Google Earth

Online Weather WMS used in ECMWF MetView

OpenGIS Compliance

Visual Weather Web Service module implements the following OpenGIS compliant services:

Web Map Service

Exposes any kind of visualization (observations, NWP data, radar or satellite imagery, lightning, etc.) in a form of raster (PNG, JPEG, JPEG2000, GeoTIFF, etc) or vector image (SVG, PDF). Visual Weather WMS implementation is compliant with OGC MetOcean Domain Working Group – Best Practice document.

Web Coverage Service

Exposes satellite or radar imagery or NWP data (both deterministic and ensemble parameters) in a form of mathematical gridded “coverage” in GRIB1, GRIB2, NetCDF, KML, JSON, GeoJSON or GeoTIFF format. Visual Weather allows in addition to accessing original grids to perform on-demand statistical processing such as time range averages, ensemble probability thresholding, vertical maximums etc.

Web Feature Service

Exposes aviation SigWx features (clouds, jetstreams, icing areas, etc.) as well as aviation observation/forecasts and warnings (METAR, TAF, SIGMET etc.) or basically any kind of in-situ data such as observations (SYNOP, AWS, lightning etc.) in GML (Geography Markup Language). Clients can apply any OGC filter (aka SQL query) to filter observations based on desired criteria.

Scalability & Performance

Important aspect of building a Service Oriented Architecture or a web application is ensuring that all services scale well with client demands. IBL has a proven expertise in delivering well performing and scalable web service solutions based on:

Source level data caching

Visual Weather uses computer memory to cache all decoded products

Tile caching

All data is converted into
image tiles which can be effectively cached and exposed using OGC Web Map Tiled Service (WMTS)

Web service load balancing

Multiple instance of Visual Weather behave like one logical cluster

If you want to build your public weather web site or local Intranet portal or perform weather forecasting over Web from any location in the world then Online Weather is the right product for you, containing:

  • Web Portal with Content Management System where you can publish all your weather products created in Visual Weather and author your custom text content or layout.
  • Interactive forecasting tools implemented as Rich Internet Applications running in Web Browser allowing to shift forecasting process from traditional workstation to lightweight web browser or tablet environment while keeping flexibility.

Key Functionality

Weather data and map visualization with layers, zooming, panning and readouts of detailed point information at mouse position, all updated in real time. Available layers include geospatial backgrounds, observations, NWP data, satellite and radar layers, lightning etc.

Interactive cross-sections and meteograms composed of both observations and NWP data for any trajectory or location.

Upper air profiles from NWP data displayed for any location selected on the map.

Split-screen multi views with different time frames, models or levels with synchronised zooming.

Production of text forecasts with final product preview functionality featuring syntax checking.

Collaborative production of graphical forecasts such as SIGWX charts, Low-level regional forecasts, surface analysis charts.

Interactive and configurable role-based task sheets driving all forecasting workflow & weather observation monitoring.

Benefits

Access from anywhere

Online Weather operates over the common Internet or Virtual Private Network (VPN) connection between client PC, tablet or phone and the Web Server. This allows your forecasters to get closer to end users using LTE/3G connection to provide really mobile forecasting service in critical life situations, major sport events or other weather sensitive occasions.

Business Continuity

In case of disasters influencing ICT operations, forecasters can use Online Weather from home or even switch to a different Web Service provider in case your central office fails. Ask IBL for more information about Disaster Recovery Planning.

Reducing ICT Total Cost of Ownership (TCO)


Based on service-oriented architecture all the computing is performed behind the scenes in your data center while user applications run in a Web Browser and do not require any installation. Both these key aspects reduce your costs needed to maintain the hardware and software infrastructure.

Effective Network Bandwidth Use


Big volumes of meteorological data available in your head office such as ensemble models, high resolution mesoscale models or satellites cannot be pushed to your regional centres with limited bandwidth. Online Weather users retrieve only products they need with all the processing done on your servers. This allows interactive access to required subsets of a high amount of data, possible even over low-bandwidth or mobile networks.

Interoperability

Online Weather is powered by OpenGIS Web Services and therefore it can be connected to any standard OGC service provider. Major world centers such as ECMWF are already exposing their product using OGC services and allow Online Weather to visualize their product online. The highest synergy is achieved when Online Weather connects to Visual Weather OGC Web Services bringing Visual Weather’s  visualization and data analysis powers straight into your Web Browser window.

Weather Drawboard

Collaborative, web based, graphical tool for drawing of weather forecasts and warnings on a map background. Publishing to Facebook and Twitter as graphical or text products, HTML5 interactive components for general public to view weather forecasts and warnings, e-mailing or faxing to users through IBL Visual Weather. The web-based warning editor is a simplified interface on top of Visual Weather’s Alert Editor functionality, which allows for flexible output product configuration and visualization of alert areas on maps. Regional offices can collaborate on preparing the forecast while simultaneously seeing each other’s work (similar to Google Docs in concept). The graphical approach saves time for meteorologists and gives immediate insight into the overall forecast by seeing what the other regional offices are doing.

This is a web-based solution requiring only recent Google Chrome or Firefox browsers on any operating system. This lowers maintenance costs for organizations because the tool is installed on central server to which the users are connecting using a web browser.

Alert Editor

Issue warnings for thunderstorms, heavy rain, strong wind, high seas, or other phenomena.

Users can specify areas affected by a hazard by marking the areas on a graphical map and adding details like the validity, severity level and other associated attributes.

Generate outputs like HTML for webpages, images for posting on social media, PDF for e-mailing and faxing, interactive web based viewers.

Distribute the products to users on Facebook, Twitter, or using FTP/SFTP, e-mail, SMS, fax and other delivery protocols.

Forecast Editor

Edit weather area polygons using freehand drawing and cutting operations

  • Weather area types are thunderstorms, rain, strong wind, fog, others can be added
  • Words like isolated, scattered, widespread are automatically determined based on percentual coverage of a region by a phenomenon
  • Edit min/max temperature for states, regions or towns on a map
  • Edit wind direction and speed
  • Users can see work of their neighbouring regions in real-time
  • Central forecast office can take over responsibility from a region and adjust their forecast
  • Work is preserved on a central server continuously (users do not need to save)

Technologies