There are lot of meteorologic variables and many of them are very advanced, but still, we are able to obtain key information just from a single parameter. If we are familiar with the parameter’s natural background, the only trick is – visualisation 🙂 We choose a dew point today which is – by definition – the highest temperature at which airborne water vapor will condense to liquid form. Surely, this is the most important process on this planet so far, but much more interesting for meteorologists is that the air masses tend to conserve dew point for very long distances from their source of origin. This is happening because of turbulent mixing with a new environment takes some time. Simply, we can trace air masses on dew point charts. The only key we need to read such charts appropriately, is the fact the warmer air can absorb more water vapor than colder air.Thus, we can take a look at the chart where sea level pressure and the dew point in 2 m above surface are depicted – figure 1.
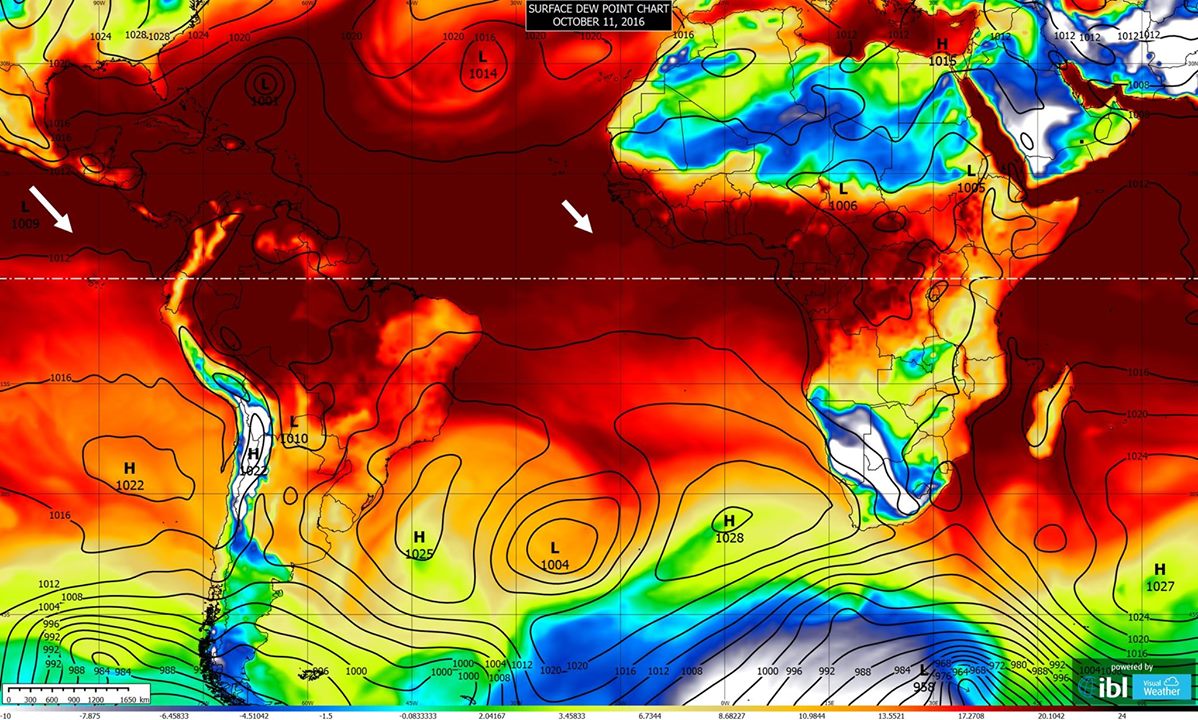
Figure 1: Surface dew point and sea level pressure chart, October 11th, 2016.
There are a lot of combinations of temperature and humidity in the air masses on the Earth, but the driest air is over deserts and in the polar frontal zone near Antarctica (bottom of the chart) – the dew point below minus 10 °C. It means there is almost no water vapor in such air no matter what temperature it is. On the other hand, the muggiest weather on the planet is near Persian Gulf, where the dew point can reach values up to 25 °C. The air has to be very warm to achieve such a huge dew point value. Thus, there is a climate, for example like you are in a just-used shower and you have no chance to get colder, because there are almost no clouds or precipitation all the year. However, our today’s focus is close to the Equator, highlighted by the white line. If we adjust the scale very carefully, we can even enhance very small dew point differences (white arrows). There is a vertically shallow boundary between humid equatorial air and a little bit drier (colder) mid-latitude air which is still not fully transformed to the new environment. As we know – a dew point is a conservative parameter – and air masses can be traced back to the area of origin by the dew point charts and even better by the animations. Thus, we made animation of surface dew point evolution from October 2 to October 10, 2016. There are large amplitude frontal waves near bottom of the animation and the cold dry polar air is pushing by the circulation to the Equator where it is still distinguished. For more convenient viewing there are three loops in the animation.
Therefore, what we are really observing on the animation is the Antarctic polar cap air reaching opposite hemisphere – this can be something like miracle for someone. However, there is less than 1 °C difference across the dew point boundary so without appropriate visualisation, almost no one knows about it 🙂
0 Comments Leave a comment