Visual Weather
Visual Weather is a meteorological software for reception, processing, and graphical representation of meteorological data, monitoring of incoming messages and values, production of textual (TAF, public forecasts) and graphical products (SWL, surface analysis, etc.) , and automatic generation of image products.The primary aim of the Visual Weather software is to integrate all types of meteorological data (forecasts, observations, imagery, etc.) into a unified presentation and workplace interface so forecaster do not have to work with several separate dedicated systems.
Why modules?
Visual Weather is used by many meteorological offices and private companies which have different data types and different needs. We have modules so that you can adjust the software to your needs and only pay for functionality that is useful in your institution. To give some simple examples: if you do not have radar data, you will not pay for the radar processing module. If you are not producing manually drawing chart, you will not pay for Feature Editor.
Visual Weather Basic Package
To put it simply, the basic package allows to receive station observations (SYNOP, METAR, TEMP, BUOY) and NWP model data, visualise this data as bulletins, report lists, 2D maps or thermodiagrams, print these outputs, or manually export the maps as images.
Data Reception and Database
Meteorological data is constantly being received via configured communication channels running as background services. Visual Weather is able to receive and store for further processing all types of messages including character-based messages (alphanumeric), binary messages (GRIB), binary-oriented BUFR and CREX messages, image-files, etc. The database optimised for storing huge amounts of meteorological data is day-file oriented. It is possible to configure how long particular data types should be kept in the database, older data is automatically removed. Certain day-files can be marked as “permanent”, so the data remains in the database for weather phenomena analysing activities and case studies.Data can also be archived into external storage.
Access to Received Bulletins
This functionality is provided by application Message Viewer and it is part of the basic package. The received bulletins can be searched based on the bulletin headings and displayed. The display supports simple text, BUFR, HTML or images.

Access to Reports
This functionality is provided by application Report Monitor and it is part of the basic package. It is possible to display the received data in a report-based manner: users can specify the required report type, time and country, station, station group or area. Multiple report types can be displayed simultaneously (e.g. METARs and SIGMETs). The display indicates validity, BBB status, airport conditions, NIL reports, etc.

Access to Images
This functionality is provided by application Image Player and it is part of the basic package. If radar and satellite images are available in image-only format (GIF, PNG, JPEG, etc.), they can be viewed as a movie loop in the Image Player application.

Data Visualisation - Maps and Thermodiagrams
This functionality is provided by application Map Editor.
Visual Weather provides highly customizable interactive display of maps.
Internally, all data are real-time interpolated and processed, which allows users to unlimited high-quality zooming, panning, and area/projection changing; zooming-in provides more detailed information of area and meteorological data.
Visual Weather allows to overlay any of the available meteorological data as separate layers: when users are working with the map, they can change the position of layers or temporarily hide selected layers.

Map areas and geographical backgrounds
This option is a data layer that is part of the basic package.Users can select any area on the globe in real time, with no restriction on the position or the size of the area. Various projections are supported, including Geographical, Mercator, Lambert conformal, Polar stereographic, Albers Equal-area, etc. The settings for the map background are customizable, and includes options for the following settings:
- Display of latitude and longitude grid (line style, size, labels, stepping, etc.)
- Display of geographical objects (land, and sea fillings, country and province borders, etc.)
- City display (font settings, selective city display, etc.)
- Station display (display type – names, WMO identifiers, ICAO identifiers, IATA identifiers, font sizes and colours, density of display, etc)
- Colour gradients for orography and bathymetry

Map background using colour gradient for topography and bathymetry, displaying lat/long lines, lakes and rivers
Visual Weather includes several databases: geographical database with shorelines, borders and rivers (resolution up to 100 meters), Digital Elevation Model (DEM) with global coverage, city database, WMO and ICAO station catalogues, volcanoes, FIR borders, etc. In addition, customer-specific shape files with local information (districts, roads, small rivers, etc.) can be displayed.

Map background using local shapefiles for Namibia (cities, districts, roads, rivers, etc.)
SYNOP, METAR, TEMP and station observations
This option is a data layer that is part of the basic package.
The following observation types are supported: SYNOP, METAR, BUOY, TEMP, PILOT, AIREP, AMDAR.Customer-specific formats (AWS, road-side observations, etc.) can be implemented at extra charge.

METAR as station plots with approach colour.
Observations can be displayed as station plots with customisable look or as single selected parameter with colour gradient, or display of plots based on specified filter (only CB stations, or low visibility stations, etc.)
The display of observations can be enhanced by Tabular Product Generation – Spot Charts module which displays a 24-hour tabular overview for the selected station.

NWP model fields
This option is a data layer that is part of the basic package. The following formats are supported: GRID, GRIB1, GRIB2, NetCDF, PNG images inside GRIB2, i.e. the following model data can be displayed:
- Global, Mesoscale, Microscale, Unified Model, GFS, MOGREPS, GME-DWD, COSMO/LME-DWD, HRM-DWD, London & Washington WAFCs, ECMWF deterministic, Arpege/Aladin, WRF, INCA, HIRLAM, HARMONIE, ETA, MM5-NCAR, RAMS, WAVE (ECMWF, UK, GKSS, ...) and others.
- Ensemble model data
Model data can be displayed as isolines (contours), isosurfaces, numerical grid, wind barbs or arrows, streamlines, cloud coverage symbols, precipitation rate symbols, automatically generated weather icons.

The graphical settings are fully customisable, including the colour gradient, line styles, isoline labels, indication of local extremes.
NWP model parameters from various levels, times or models can be overlaid.

It is possible to select that for a certain parameter, instead of the values from the selected level and time, the display should show the maximum/minimum/average from the selected time range or level range. For precipitation parameters it is also possible to specify the required accumulation period.


Ensemble model data can be displayed in a variety of ways:
- display selected ensemble member
- overlay several ensemble members on one map for an easy comparison
- display the minimum/maximum/average of all ensemble members
- display percentile forecast
- display the probability of the forecast reaching a specified threshold


Creation and display of custom parameters
This option is a data layer that is part of the basic package.
Users can calculate custom parameters using the predefined functions (sums, differences, averages, tendencies, derivations, goniometric operations, logical operations, thermodynamic functions, etc). The function are designed interactively on screen. This allows to visualise a wide range of outputs, e.g. computed icing probability, wind-shear as difference of wind in two levels, 24-hour temperature tendency, difference of two different models or two subsequent model runs, etc.

Animations
This option is an interactive tool that is part of the basic package.Any displayed data overlay can be animated. The Animator window is independent from the main map display of the Map Editor, therefore, in addition to the static map, several animations can run in the Animator windows.
- It is possible to adjust the number of frames, size of the Animator, animation speed, and the type of looping (backward, forward, swing).
- Zooming, panning and tooltip value display are available during the animation.
- The animations automatically update with new data arrival.
- In case of multiple Animators= windows, the animations can be synchronized.
- It is possible to save the animations so that the users can open them from a shortcut (the animation open with the latest data).

Multi-view
This option is an interactive tool that is part of the basic package.The multi-view tool allows to display several map displays at the same time for easy comparison. The following options are included:
- Multiple maps: a set of specified maps, for example the forecast of temperature, precipitation, clouds, and humidityTime series: several time frames of the same map, for example the +12h, +24h, +36h, and +48h forecasts
- Run series: comparison of forecasts from several runs
- Time series from multiple models: comparison of forecasts from several
- Levels: several levels of the same map, for example the 850hPa, 700hPa, 500hPa, and 300hP levels
- Ensemble datasets: several members of the parameter from the ensemble model


Statistical evaluation of NWP field within selected area
This option is an interactive tool that is part of the basic package. This tool is used to calculate various statistics (maximum, minimum, etc.) of the selected NWP parameter within the specified polygon. The user can manually draw polygons or use saved polygons and select one of the parameters displayed on the map: the statistics will display the values for the selected polygon and parameter.

Distance Measurement
It is possible to measure the distance on a map in the following ways: between any two points selected on the map, for example to measure the distance between two pressure lows.

- the radius, area and circumference of a circle

- distance from a 'favourite' point, e.g. to measure the distance of the rain area from the city
Thermodiagrams and hodograms
Upper-air observations (TEMP, PILOT) and NWP model data can be displayed as a hodogram or one of the following thermodiagrams: Tephigram, Skew-T, Aerogram. Emagram, and Stuvegram.
It is possible to configure the temperature and pressure coordinates, the included lines (potential temperature, cloud coverage, etc.), the display of wind data, the list of indices that should be displayed in the legend, etc.

Thanks to overlay options, it is possible to display sounding charts from various sources in the same display, e.g. compare the sounding chart from two stations, or two times or from observation and model.
The display of upperar-air data can be enhanced by Upper -Air Profiler and Thermodiagram Tools module.
Legends
The map can include several legends and the legends can include automatic display of the colour gradients used for data visualisation, user-edited text, images (e.g. the logo of your meteorological organisation), etc. The graphics of the map legends can be to customized. The map legends can contain references to the map, i.e. information about the validity, level, model centre, etc. is automatically updated in the legend.
Printed or electronic output
All graphic processing is vector based, therefore high-quality printing is guaranteed on the media of any size (up to paper size A0 and more). Since the printing is not hard-copy based, details increase with the increase of the paper size or the printing density.
The images produced by the visualisation tool can be exported to a variety of formats (JPEG, PNG, GeoTIFF, PDF, SVG, KMZ, etc.)
Modules for data decoding and visualisation
Objective Analysis
This module is a data layer in Map Editor. This module will let you display a data layer showing the analysis of the selected observation parameter, e.g. MSL pressure, precipitation, surface temperature, upperair temperature etc. The layer can be added to a map as the only layer or it can be overlayed with other data layers. The illustration below shows a MSLP objective analysis layer in combination with layers showing the MSLP values and the MSLP tendency values.

The layer specification allow to set various characteristics of the analysis, including:
- Analysis method (Akima, Barnes, CONPAC) with options to adjust the settings for the give method
- Quality control (excluding data above and beyond thresholds, median quality control)
- Option to set up rules for modification of the analysis by taking into account the values from the NWP model.

On Screen Analysis (OSA)
This module is an interactive tool in Map Editor. This module is an extension of the Objective Analysis module.
The module allows to create an analysis not as layer, but with an interactive tool where the user can select the observed parameter and the NWP model to be used for comparison.

The OSA Wizard tool allows to display and toggle on/off the analysis, the NWP model, the difference between analysis and model, the observation plots and the satellite data.
- The analysed parameter joins all relevant observations from various report types, e.g. for the temperature analysis, the temperatures values from SYNOP, METAR, and BUOY observations will be used.
- It is possible to quickly apply the desired degree of smoothing to the analysed isolines.

The display of the analysis vs. model display (red and blue areas) helps to identify areas where some of the observations might be incorrect or unsuitable. It is possible to manually correct such observations or even reject the observation.

After the correction or rejection, the analysis will be updated. The “OSA Log” which can be displayed in a dialog keeps track of the observations that were rejected/corrected by user or by the automatic quality control.

For areas with insufficient amount of observations it is possible to add “bogus” observations: the analysis will be also updated, taking into account the manually inserted values.
The final analysis can be also exported into a GRIB: this GRIB data can be re-used in the same way as GRIB which contains the model data. Note that the exporting to GRIB can be carried manually or it can be done automatically in regular intervals by the Task Editor module.
Satellite Image Processing
This module is a data layer in Map Editor.
Supported formats include:
- Geostationary satellites:
- GRIB1 and GRIB2 (for example Meteosat Second Generation or Himawari converted from HRIT/LRIT/HSD format by Satellite Weather module or by customer’s own satellite reception package)
- CF NetCDF Grid
- GeoTIFF or PNG/JPEG/ with manually specified projection and calibration (SeaSpace TeraScan; various systems),
- McIDAS AREA (GOES East/West, MSG, FengYun 2D/2E, MTSAT),
- GOES GVAR (conversion to GRIB2)
- S-VISSR (Feng Yun 2D/2E by conversion to GRIB2)
- VCS XPIF,
- Tecnavia GRIB,
- Kongsberg MEOS HDF5 (MSG mainly),
- Autosat (UK MetOffice)
Polar data (by conversion to GRIB2)
- ASCAT (ocean surface winds from Advanced Scatterometer onboard ESA's satellites)
- RapidScat (ocean surface winds from scatteromater onboard the ISS)
- OSCAT, QuickScat (ocean surface winds, but satellites already decommissioned)
- ATOVS BUFR (Advanced TIROS Operational Vertical Sounder) (conversion to GRIB2 for specified lat/lon area)
- MODIS satellite in HDF-EOS5 (conversion to GRIB2 for specified lat/lon area)
- NPOESS in HDF5 (conversion to GRIB2 for specified lat/lon area)
- McIDAS AREA (AVHRR data) (conversion to GRIB2 for specified lat/lon area)
Unsupported file formats can be implemented at extra charge.This module will let you display a data layer showing satellite data from geostationary satellites. The visualisation of the satellite data is fully configurable.


The module also supports the following:
- Displaying the difference or linear combination of channels
- Display of satellite data as “sandwich” products, i.e. satellite products which use HRV channel as a 'background image', and a colour-enhanced IR image on top to get the fine resolution features from HRV and the colouring according to IR information.
If you have the Meteogram and Cross-Sections module, you can create a cross-section, it is also possible to create a cross-section across the satellite data simply by clicking the start and end points on the map: this will show the cross-section in the main display and the original satellite image in the side map. It is possible to use the side map to interactively change the cross-section points.


Satellite Weather: Basic Receiving and Extraction System
Module required for reception and conversion of Meteosat Second Generation or Himawari from HRIT/LRIT/HSD to GRIB.
Radar Image Processing
This module is a data layer in Map Editor. Supported formats include:
- FM-94 BUFR (WMO standard, OPERA standard, EEC/DRS, Gematronik, Vaisala/SIGMET, CERAD composite),
- FM-92 GRIB and GRIB2 (EEC/DRS, various systems),
- GeoTIFF (various systems),
- TITAN MDV grid and polar data,
- ODIM HDF5 data (2D cartesian),
- NIMROD (UK MetOffice specific)
- other third-party radars (Australian BoM ROWLF radar, Gematronik, HMIS SRD-2),
- L3 NEXRAD data (by conversion to multi-site composite GRIB2),
- Australian BoM Radar Shapefiles
Unsupported file formats can be implemented at extra charge.
This module will let you display a data layer showing radar data.The visualisation of the radar data is fully configurable. Multiple radar can be merged into a single layer, with a configurable strategy for overlapping areas.Users can interactively change the radar source, colour scheme or elevation (in case of CAPPI radars).

If you have the Meteogram and Cross-Sections module, it is also possible to create a cross-section across the radar data simply by clicking the start and end points on the map: this will show the cross-section in the main display and the original radar image in the side map. It is possible to use the side map to interactively change the cross-section points.

Volumetric 3D Radar Processing and Vertical Profiler Module
This module is a data layer and an interactive tool in Map Editor.
Supported formats include:
- OPERA 3 BUFR format
- ODIM BUFR polar and gridded
- ODIM HDF5 data (polar volumetric)
- TITAN MDV grid and polar data
- EEC EDGE NetCDF (polar sweeps and derived products)
- Gamic Enigma HDF5 Polar
Unsupported file formats can be implemented at extra charge.This module allows processing and display of volumetric multi-elevation polar data (3D radar).

Users can interactively change the radar source, colour scheme, select the type of top view and side view and select elevation angle or altitude (in case of CAPPI/PPI top view). The available top views, i.e. the image displayed on the map area are:
- PPI: (only for polar radars) visualizes one radar scan at specified elevation angle
- CAPPI: visualizes one horizontal layer at the specified altitude
- Maximum: visualizes maximum in the volume column under a pixel.

It is possible to view side views, i.e. 2D projections on the top and the right side of the map that show the values viewed from the side (instead of the 'viewed from the top' view which is displayed on the map). The line in the side-view indicates the height from which the values are displayed in the top view.

If you have the Meteogram and Cross-Sections module, you can create a cross-section, it is also possible to create a cross-section across the volumetric radar data simply by clicking the start and end points on the map: this will show the cross-section in the main display and the original radar image in the side map.
It is possible to use the side map to interactively change the cross-section points.

Satellite Application Facility Products Processing
This module is a data layer in Map Editor. Module is used to decode and display Satellite Application Facility (SAF) products from the following applications:
- LSA SAF (HDF5) : land surface analysis products in HDF5, displaying for wild fires, vegetation stress, surface radiation budget, snow cover data, etc.
- NWC SAF (HDF5/BUFR): nowcasting products in HDF5 and BUFR: rapid development thunderstorms, cloud type, dust detection, volcanic plume detection
- Ocean and Sea Ice SAF (BUFR/GRIB) : ocean surface winds (ASCAT), sea surface temperature, radiative fluxes, sea ice coverage.
- EumetSat MPEF: Meteorological Product Extraction Facility in GRIB and BUFR, e.g. AMV (Atmospheric Motion Vectors), ELW (Expanded Low-resolution Winds), HRV (High Resolution Visible Winds), HWW (High Resolution Water Vapour Winds), WVW (Clear Sky Water Vapour Winds), GII (Global Instability Index), RII (Regional Instability Index), CLAI (Cloud Analysis Image), CLM (Cloud Mask), CTH (Cloud Top Height), FIRG (Fire Monitoring), MPEG (Precipitation Estimate)


Lightning Information Processing
This module is a data layer in Map Editor. It will let you display a data layer showing lightning data on maps.
- Supported formats include CSV/TXT/XML formats.
- Supported detection systems include SFERIC, SFLOC, UALF, EUCLID, LINET, GPATS, ALDIS, SAFIR, FLASH.
Unsupported formats can be implemented at extra charge.


If you have the Meteogram and Cross-Sections module, you can create a cross-section that will show the number of lightning strokes per given time interval for specified area.

If you have the Weather Alerts module, you can create an alert that will send a notification that a lightning occurred in the specified area
Web Camera Processing
This module is a data layer and an interactive tool in Map Editor. The data layer shows all available web camera locations: after clicking the camera symbol a window with the latest image from the selected web cam will be displayed.The display can be refreshed manually or automatically at specified period. It is possible to display several web camera windows simultaneously.

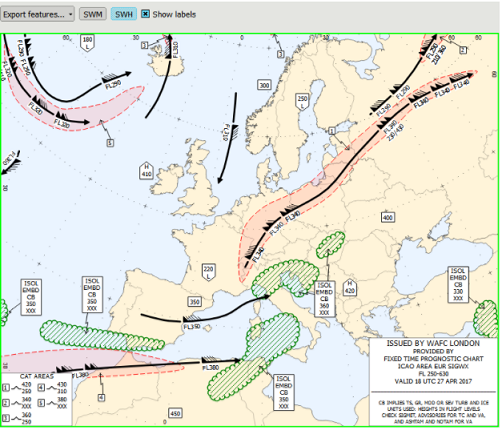
SIGWX Processing
This module is a data layer in Map Editor. This module will let you display a data layer showing the significant weather charts generated from BUFR for the selected map area. It is possible to switch between the WAFC London and WAFC Washington data or between the high- or medium-level SIGWX. The graphics for the SIGWX objects are fully configurable, so you can specify your preferred colours and styles for jets, clouds, CAT areas, etc.
Upper-Air Profiler and Thermodiagram Tools
This module is a set of interactive tools in Map Editor. Roaming Profile is a tool which displays an additional sub-window with the thermodiagram for the point selected on the map. The profile can be based on forecast or observation data. As the mouse pointer is moved on the map, the thermodiagram valid for the location is displayed.

Ascent Navigator is a tool that enables a fast and easy selection of data sources for the comparison of upper-air data from various data sources.

Ascent Diagnostics is a tool that displays a set of tabulated values based on the displayed upper-air data: indices, temperature overview, wind and wind shear overview, vertical velocity, lee waves, etc.


Modification tools include:
- CAPE tool which calculates the CAPE value from the areas of intersection between the isentrope and the temperature line (difference of the red-shaded area and the blue shaded areas) and the CIN value. It is possible to move the surface temperature and dew-point temperature points to modify the CAPE and CIN calculation.

- Normand Point tool and Fog point tool for determining the Normand Point and Fog Point (temperature at which radiation fog could form for a given airmass)

- Temperature and wind modification tool which allows to change the temperature, dewp-point temperature or wind values at any level in order to study the effect of these changes for example in the diagnostics tables. The change can be done as a mouse action (dragging a point) or by entering exact values into a value modification dialog.

Windshear measurement tool enables to calculate the wind shear and distance between any two selected levels in the thermodiagram.

Ocean Profiler
Ocean observation profiler, interactive mouse roaming profiles, display of tabulated and graphical diagnostic values.
Wind Profiler Data Processing
This module is a data layer type and a set of interactive tools in Map Editor.Supported formats include: Unsupported file formats can be implemented at extra charge.This module enables to display the wind profiler data the following ways:
- Map layer with station plot for a single level

- Time series that displays wind-barbs, isotachs, vertical velocity

- Display of wind column in Ascent navigator

- Hodogram

Radar Ducting
This module is an additional information display for thermodiagrams in Map Editor. This module enables to display the ducting information as part of the thermodiagram display :
- in a tabular form

- as colour bar indicating layers where ducting or trapping appears

Meteogram and Cross-Sections
This module is a product type and a set of interactive tools in Map Editor.This module allows to create meteograms (time-based cross-sections) and horizontal cross-sections from observations, NWP model data, satellite data, radar data, or lightning data.The data in the cross-sections can be visualised as lines, isolines, bars, wind-barbs, Visualization is in form of lines, histograms, bars, wind-barbs, error bars (used for ensemble data), confidence intervals, weather symbols etc.
For meteograms users can interactively change the time range and location by using the side window or the model by using the global toolbar.

For route cross-sections users can interactively change the route by clicking on the map in the side window. The point where user places the mouse on the cross-section is highlighted in the side-window as a red cross.
The users can also specify the time for the start point and end point: data from different forecast periods will be used; this is useful for long-haul flights.

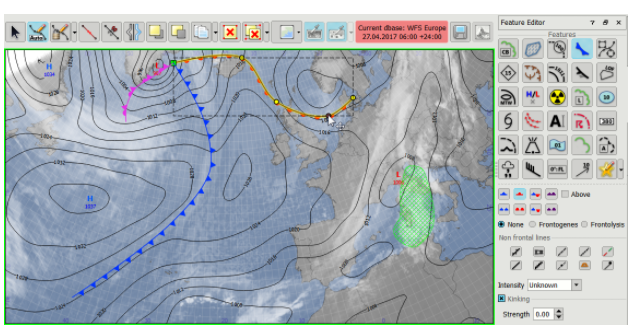
Trajectories and Feature Tracking
This module is a set of interactive tools in Map Editor.
The Feature Tracking tool calculates the distance, direction and speed between points at different time frames. This can be used to track features, for example a low in a series of forecast MSLP fields, or a region of heavy rains on a series of radar images. Note that this is not an automatic tracking, so you have to manually click the positions of the tracked feature at each time frame: after clicking the positions at various times, the side window will display the distance between the clicked points and the calculated speed of movement.
The tool allows extrapolation of the future position of the tracked feature. This is useful if you have an indication of some severe weather, e.g. observations of heavy rain from radar, a forecast of deep low pressure area, and you want to see the prediction of a future position based on the previously clicked track points.

It is possible to use the tool in a way that it computes the values for tropical cyclone track and then allows to export these values to Cyclone XML (CXML). The export options allow to specify the cyclone name, used NWP model, etc.

The Trajectory tool allows to create trajectories, i.e. the supposed motion of an air particle over a selected period, if the particle is influenced by the wind as forecast for a certain level. The user can select the NWP model and level for the wind and the time period for the trajectory. Multiple trajectories (i.e. wind for different models and/or levels) can be used. It is also possible to show “backward trajectories”: trajectories where the user selects the destination location, not the starting point location. In the normal trajectories, the user clicks a starting point to see where the particle starting at this location will end up. In backward trajectories the user clicks the location to see from where a particle should start in order to end up in this location.


Tabular Product Generation – Meteo Chart
This module is an application called Meteo Chart.This module displays values from observation and NWP model data in tabular form. It is possible to create tables that show values from various locations, or for the same location at various times, levels, etc. The tables are completely customisable. The users can use the toolbar to interactively change the model, time, locations, etc.

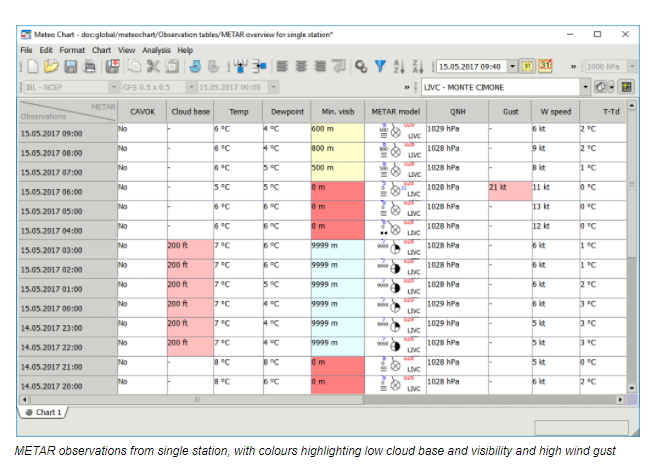
It is possible to compare observed and modelled parameters in one table.

It is possible to apply colour gradients to highlight cells with certain values.

It is possible to set thresholds for the whole table, or only for selected cells and use the table for monitoring and alerting: the cells beyond threshold are highlighted in the table, the locations are highlighted on a side map and the alert can automatically appear in the Main Panel even when the table is not open.

Tabular Product Generation – Spot Charts
This module is a an interactive tool in Map Editor.This module displays a tabular overview of observations from a 24-hour period. When you are displaying a map that shows SYNOP, BUOY or METAR observations, you can click an observation station to display a separate window with an overview of observations as tables (station plot table, parameter table, observation text table).

Modules for Forecast production
Distributed Role Management and Regular Tasks
This module is an application called My Tasks.This module is used to create a list of regular tasks that forecasters working in particular roles have to do daily, e.g. provide briefing, check weather maps, issue TAF, issue text forecast, draw the graphical weather product, etc. The users can select the role(s) in which they are working and the shift (i.e. time period) and the task list displays a to-do list.

The to-do list shows the name of the task, detailed description and the scheduled time. The list is useful for the following purposes:
- Keep track of the jobs that have been completed and jobs that still have to be done
- The action buttons provide direct access to the message form or map. For example, when the user click the “Create” button for the TAF job, the TAF form will open. If the user click the “AMD button next to the completed TAF job, the form for amending the TAF will open.
The module includes a display of execution statistics that can be used by supervisor to check the execution status of the tasks for a particular role and time period. The displayed information shows the user who completed the task, when the task was completed, whether the task was completed on time, etc.

- x
Weather Charts and SIGWX Editing
This module is a an interactive drawing tool called Feature Editor (used in Map Editor).The tool includes a large number of basic drawing objects: fronts, clouds, jet streams, turbulence areas, isolines, weather icons, wind barbs, pressure centres, text boxes, etc.
- Each object has a set of options that allow to specify certain characteristics of the object: selection of front type for fronts, selection of cloud base, top, type and distribution for clouds, selection of font and text-box colours for text, etc.
- The drawing is done by simple mouse-clicking or mouse-dragging. Any time during drawing it is possible to select an object that was drawn and change its shape, position or characteristics.
- Any kind of meteorological data can be used as an underlay when drawing to help the forecasters during the drawing. It is possible to associate certain maps with certain object type, so when the users select fronts, a map with pressure data is displayed, when he selects jets, a map with wind barbs and wind isotachs is displayed, etc.
- It is possible to import objects from other products or isolines from analysis or NWP model data. For example, when issuing the significant weather charts, users can first import the objects from the high or medium level SIGWX issued by WAFC London or Washington and edit them. Or, when issuing a new weather situation drawing, users can import the objects that were drawn for the previous validity and edit these objects. Or, when issuing an analysis product, users can import the automatically analysed isobars and edit them.
- Each drawing is stored in a special internal database with a specific product name, time stamp, and geographical referencing. Thus it is possible to use the drawing as a map layer and overlay it with other meteorological data that has the same validity. It is also possible to change the projection type or the map area: thanks to georeferencing, the objects will be correctly repositioned.
Weather Charts and SIGWX Editing – Collaborative extension
This module is a an extension of Feature Editor.Extension of basic Weather Charts Editor to allow simultaneous work of multiple forecasters on the same product, in a controlled way. This could be used for organizations where forecasters from multiple regions are contributing to the same forecast product. The actual drawing works in the same way, but collaborative editing has the following features:
- The first user who starts editing becomes the master of the editing session and only he can save and issue the product.
- Several other users can join in to edit the product at the same time, immediately seeing the changes done by the other users.
- There is an indicator showing the usernames of all participants, with special highlight used for the master of the session.
Weather Charts and SIGWX Editing – Graphical SIGMET Editor
This module is a an extension of Feature Editor.This module allows to specify the SIGMET phenomenon area and features graphically and automatically convert it into a to SIGMET text bulletin. This module is useful if your office is responsible for issuing SIGMETs.
The configuration includes the specification of various customer-specific features: FIR, default validity period, preferred underlay map, etc. The issuing of the SIGMET is usually initiated by clicking a shortcut that opens the preferred map underlay and activates the SIGMET drawing tools.
The forecaster can select the type of feature: Turbulence, Thunderstorm Area, Icing Area, Mountain Wave, Dust/Sand Storm, Volcanic Ash or Tropical Cyclone, adjust the validity (default validity is usually set as start time=current time, end time=start time + 4 hours), specify the level, movement etc. and draw the phenomenon area.

For volcanic ash SIGMETs and tropical cyclone SIGMETs the drawing includes an option to import the volcanic ash or tropical cyclone advisory and use the area from the +6-hour forecast as the SIGMET area.
The location can be drawn in various ways: the drawing supports all location types allowed by ICAO regulations, i.e. Polygon, Wide line, Line and direction, Two polylines and direction, Lat/Lon range and direction (Band), Lat/Lon and direction, Place or Entire FIR.


After confirming the graphical SIGMET, the graphics are converted to a bulletin form.

The user can revise and preview the text form and issue the SIGMET.

All issued SIGMETs are displayed on the Main Panel, in the section which provides an overview of all issued warnings. SIGMETs can be cancelled with a single click, or expiring SIGMETs can be renewed.

Weather Charts and SIGWX Editing – Graphical AIRMET Editor
This module is a an extension of Feature Editor.This module allows to specify the AIRMET phenomenon area and features graphically and automatically convert it into a to text bulletin. This module is useful if your office is responsible for issuing AIRMETs.
This module is similar to the SIGMET module described above, but the supported object types are: Turbulence, Thunderstorm Area, Icing Area, Mountain Wave, Mountain Obscuration, Cloud Area, Surface Visibility, Surface Wind, Freezing level.

Weather Charts and SIGWX Editing – Low Level SIGWX Editor
This module is a an extension of Feature Editor.
This module allows to create low level significant weather charts (SWL, LAF) where text descriptions are specified for the weather areas during the graphical editing

The drawing tool supports several types of area descriptions (ICAO standard, UK Met Office Standard, BOM Australia standard, Aeronautica Italia standard, etc). IBL can develop also other types of weather descriptions.
When the forecasters issues the low level significant weather chart, the drawing is converted into a document consisting of the drawing and the table with the weather area descriptions. IBL can adjust the output to provide the required look and layout of the low level significant weather chart.

Note that if your ow level significant weather chart consist only from drawing and map legend, you do not need this module.
Weather Charts and SIGWX Editing – Volcanic Ash Advisory Editor
This module is a an extension of Feature Editor.
This module allows to specify the volcano and volcanic ash cloud graphically and automatically convert the result into a volcanic ash advisory bulletin. This module is useful if your office is a VAAC (Volcanic Ash Advisory Center) responsible for issuing volcanic ash advisories.
The forecaster can specify various information (type, colour code, source data) , add the volcano from the global volcano database and draw the observed and the forecast volcanic ash clouds.

The location can be drawn in various ways: the drawing supports all location types allowed by ICAO regulations, i.e. Polygon, Polyline and width, Vertical extent only, Not identifiable.
The clouds drawn for different period are drawn with different line style and clouds drawn for different level ranges are drawn with by different colour.


After confirming the graphical VAA, the graphics are converted to a bulletin form.

The bulletin form allows to adjust the map area that will be used for the graphical VAA.
The output of the bulletin form is a text VAA, graphical VAA and VAA in IWXXM format.
On request, IBL can also install, configure and integrate the NOAA HYSPLIT dispersion model: the forecasters will have an option to use the HYSPLIT simulation as a guidance for drawing the volcanic ash clouds.
Weather Charts and SIGWX Editing – Tropical Cyclone Advisory Editor
This module is a an extension of Feature Editor.
Extension of basic Weather Charts Editor to allow graphical production of advisories by Tropical Cyclone Warning Center. Includes historical track database, intensity estimation tools, Dvorak Objective Technique, CXML tracking export.

On-Screen Field Modification – Framework
This module is a an interactive tool in Map Editor.which used to use a graphical tool to modify the values of the selected NWP field. The following modifications are supported:
- Graphical movement of points and isolines with an option to modify values. or correction of values in a selected area. The moving of isolines automatically influences the whole field, i.e. all surrounding isolines are moved correspondingly to the decreasing distance from the moved isoline.

- Smooth fields option used for smoothing away discontinuities or eliminating multiple minor low and high centres which may clutter up the chart.
The modification result is then exported to GRIB1 or GRIB2 format, so that the modified NWP data can be used for data visualisation and in all other applications processing or displaying model data.
On Screen Field Modification – MetMorph
This module is a an interactive tool in Map Editor.This module is a more advanced tool for the modification of NWP model:
- t
- The modification is meteorologically consistent (technique based on distortion of potential vorticity), i.e. the modification of one parameter influences the other related parameter, e.g. a change in MSLP pressure changes the wind values, the modification in one level influences the values in other levels and the modification can be time-linked, i.e. if the forecasts for +6 and +24 are changed, the forecast in +12 will change accordingly. t
- A wide range of modifications is available, including: potential vorticity change which influences all parameters, using radar data to modify the analysis time in the precipitation model data, advection of precipitation influenced by the forecast wind, smoothing, merging data from two models, etc.

The active Field Modification session is stored as a special model IBLFMCUR. Thanks to this, it will be possible to preview the impact of modification in maps, cross-sections and roaming profile, before confirming the modifications.

The modification result is then exported to GRIB1 or GRIB2 format, so that the modified NWP data can be used for data visualisation and in all other applications processing or displaying model data.
Model Intervention
This module is a an interactive tool in Map Editor.This module is only useful for meteorological services which compute their own NWP model. The Model Intervention is a special tool used for comparing the selected NWP model forecast to the actual observations: stations that have values different from model are highlighted in colour. It is possible to:
- support the values from observations, i.e. declare that the observed values are correct and should be issued as “model intervention” to improve the next model run
- amend the observations and create 'forecaster-generated observations'.
- create surface or upperair bogus observations
These observation are inserted back into the numerical model data assimilation process.

Another purpose of the Model Intervention is to create Tropical Cyclone bogus observations in case that there are observations suggesting the presence of tropical cyclones that the model was not predicting, or was underestimating. The TC bogus will be used to influence the wind speed and wind direction forecasts in the next model run.

Form Based Production Framework – Message Editor
This module is an application called Message Editor.This module allows forecasters to edit and issue products, such as TAF bulletins, public forecasts and other products where the output is in the form of documents, text bulletins, XML or other custom formats.
The users are using various input boxes, list-boxes, check-boxes, etc to edit the form. It is possible to configure the form in a way that it automatically inserts observed values or NWP model values to the input boxes to be used as first-guess values that the forecaster can manually edit.

It is possible to specify validation rules for the forms to avoid leaving compulsory fields empty, to avoid typing mistakes and to cross-check various fields.

Form Based Production – Open Office module
This module is a an extension in the Message Editor application.You will need this module if the text products that you want to produce are not simple text, but documents that use font styles, headers, etc, i.e. output that has to be designed in Open/Libre Office (we use Open/Libre Office because it is open source). This module is also used when the required product outputs is PDF (the Open/Libre Office is used as an intermediate step between the form and the PDF).


Form Based Production – Marine Forecast Production
This module is a an extension in the Message Editor application.If your forecast service performs marine forecasting, this module allows you to create ship route forecast and marine tow forecast designed for supporting marine operations such as towing of oil rigs, ferry transport and so on. Routes for ships can be either interactively clicked or adjusted on the map, or stored in predefined typical shipping routes in a library. Produced forecast is in form of table, containing model-extracted wind, wind gust, sea-state, waves and swell, visibility (given appropriate numerical models are available).


Modules for Alerts
Weather Alerts
This module is an application called My Alerts which is configured in the Task Editor.The configuration allows to specify thresholds to monitoring values from of observations, NWP parameters, satellite or radar data for a list of locations or a whole area, for example thresholds for visibility, wind speed, precipitation, etc.

The alert summary is displayed in the 'My alerts' section of the Main Panel.

After clicking the alert, the full alert table is displayed, showing the values for each monitored location, or only for locations where the value is beyond threshold.

It is possible to switch to map view which shows the monitored locations on the map:

Alert Editor
This module is an application called Alert Editor.This module allows to graphically edit area-based weather hazard warnings (MeteoAlarm style) which supports the following features:
- Automatic generation of proposals of alerts based on NWP data and observations
- Editing of alerts using an interactive map divided into areas (counties, districts, etc): it is possible to enter the required text (e.g. headline), select the alert type and period and to specify the areas by simple mouse-clicking

- Preview of generated alert outputs
- Distribution of alerts in a form of CAP and other derived products
- Evaluation of alert successfulness
- Web-page component for interactive viewing of the alert map.

Note that this module has to be customised for each user because of the customisation of alert regions, alert types, custom outputs, etc.
Modules for Aviation Forecasting
Aero Weather Add-On
This module is an application called Aero Weather.The module can be integrated to Visual Weather or provided as a standalone software to function as a standalone WAFS workstation compatible with SADIS SecureFTP & WIFS.The module includes options for monitoring the meteorological data by providing access to received bulletins, warnings, reports and maps

It is possible to define specific flights and the flight folder content for the flights. The OPMET information (METARs, TAFs, warnings) and the map areas can be set to be acquired automatically on the basis of the flight route.

The flight folders can be viewed and manually printed or e-mailed, or they can be automatically generated at the specified times.

The module can be delivered with an in-build web portal. The web service allows integration and interoperability with external web portals, e.g. the the airport central information system.

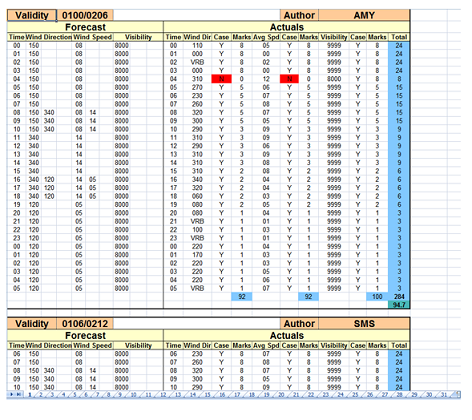
Form Based Production - Take-off aerodrome forecast, monitoring and verification
This module is a an extension in the Message Editor application.This module is recommended for forecasting operations related to one or more airports, if your forecasting office provide ICAO Annex 3 Chapter 6.4 take-off forecast.
It is an extension of Production Framework and allows graphical/tabular production of surface, lower winds and QNH for the aerodrome. The forecast product is a table containing winds at surface and 1000ft, QNH at airport, temperature at surface and 1000ft.
Module also contains real-time monitoring for amendment criteria and statistical long-term accuracy evaluation of issued forecast.


TAF Monitoring and Verification
This module is an application called TAF Monitoring.Real-time evaluation and statistical verification of the TAF forecast quality based on comparison with METAR observations according to ICAO Annex 3 criteria.
This module includes real-time TAF monitoring: comparison of the values forecast in the TAF, valid for the current time, and the values that were actually observed in the latest METARThe configuration of the realt-time TAF monitoring includes the stations for which the verification should be done, the parameters that should be compared, thresholds for tolerated differences and the way the notification about the difference should be made available to the users.

One of the possible notifications is a notification displayed in the Main Panel: immediately when the differing METAR observation is received to the database, the user will see a notification stating the difference between TAF and METAR and the full TAF and METAR texts.

If the TAF is created in Visual Weather, the Main Panel will include a button to create a TAF amendment.
This module also includes long-term verification statistics of the TAF reports where the success of forecasts is evaluated against the METAR observations, usually for monthly periods. The forecast performance scores are provided in Microsoft Excel or XML.
Aerodrome Warnings Based on TAF
This module is an additional option in the TAF Monitoring application.For the stations for which the TAFs are monitored, it is possible to specify the weather elements that should be monitored in order to automatically generate aerodrome warnings.

When the forecaster issues a TAF containing such an element, e.g. thunderstorm, snow, dust, etc., the Main Panel will display a notification that an aerodrome warning for the station should be issued and generate the aerodrome warning text: the forecaster can simply click open and revise and issue the aerodrome warning. For this module it is also necessary to have the “Form Based production Framework” module, i.e. the Message Editor application, because the aerodrome warning form has to be specified in this application.

METAR TREND Verification
This module is an additional option in the TAF Monitoring application.This module allows to evaluate the success of the TREND section in the METAR against the consecutive METAR observations, usually for monthly periods, according to ICAO Annex 3 criteria for Operationally desirable accuracy of forecasts. The checked values include wind direction, wind speed, visibility, occurrence of precipitation, cloud amount and cloud heightThe result is a HTML file which contains the following information:
- Overview table summarizing the success of each TREND, parameter by parameter and overall.

- Detailed evaluation of each TREND

Special AIREP handling
This module is a special workflow configured in Message Editor and Task EditorAlerts forecaster on reception of ARS from ATC center and offers SIGMET/AIRMET/AIREP creation with first-guess auto-text. The workflow works in the following way:
- Pilot informs the air traffic control centre about weather hazard, e.g. turbulence and the air traffic control centre will issue a Special AIREP based on the information from pilot: this Special AIREP is only sent to the meteorological office, more precisely to Visual Weather.
- When a Special AIREP is received by Visual Weather, a notification will appear in the 'My notifications' section of the Main Panel, so the on-duty forecaster is informed about the Special AIREP.
- When the forecaster clicks the Special AIREP notification, its content will be displayed and also 3 buttons will appear:Issue as ARS
Keep the structure and the content: this is used if the information should be issued as is, i.e. as Special AIREP. This opens the Special Airep form in Message Editor
Issue as SIGMETCreate SIGMET based on the Special AIREP: this will open the SIGMET form in Message Editor and copy the time of observation and phenomenon type and location if possible. The rest will be manually edited by the forecaster
Issue as AIRMETSimilar as SIGMET, but the AIRMET form will open; different types of phenomena are covered by AIRMET

NOTAM Database
This module is a data layer in Map Editor.The module handles a long-term database and decoding of NOTAM reports. NOTAMs are not strictly meteorological data; they are notices filed with an aviation authority to alert aircraft pilots of potential hazards along a flight route or at a location that could affect the safety of the flight: hazards such as air shows, closed runways, temporary erection of obstacles near airfields (e.g. cranes), etc. Therefore, for certain offices, especially offices dealing with aviation forecasting, such information display can be useful. The NOTAM layer shows circles for NOTAM valid for aerodrome and squares for NOTAMs: the label indicates the ICAO code and the NOTAM ID and the tooltip displays the NOTAM body.

Modules for Automatic Production
Background Batch Processing (Scheduler & Task Editor)
This module is an application called Task Editor.This module is used for configuring automatic tasks, i.e. the jobs that should be executed automatically at certain time or when a specific event occurs.

The time or event which specifies when a job should be executed is referred to as trigger. A large number of trigger types is supported: periodical schedule, arrival of model data, arrival od specific bulletin, completion of manual drawing, etc. The automatic jobs include the following types:
- generation of images from maps: this is the most common automatic job which allows to generate an image, e.g. satellite map, precipitation forecast map, etc. and store it into a directory, or send it to web site, etc.
- system housekeeping used to remove redundant data files
- automatic generation of text product that do not require manual editing
- creating GRIB files from analysed observation data
- execution of a specified script.

Derived NWP Field Diagnostics
This module is an application called Field Diagnostics.This modules contains computations of more than 80 derived parameter fields (vorticity,wind shear, thermodynamic indices such as CAPE index, K index, etc, advection parameters, wet bulb potential temperature and others).The module allows to specify a set of required field parameters and specify from which model, level and forecast period they should be computed.

Operationally, the module is used in conjunction with the Task Editor application: it is possible to set up a background job which automatically computes the set of selected derived fields when new model data arrives to system.After the computation is completed, the derived fields will be available for visualisation the same way as the original NWP model fields.
NWP Field Cutter
This module is an application called Field Cutter.This module allows to “cut out” from the original model data a set of specified NWP parameters for a particular area, levels and forecast periods and store these values as GRIB, GRIB2 or text. The aim is to be able to send this data to a third party (for example a regional centre, a forecasting unit on a ship, etc) where the connection properties or the storage capacity do not allow the sending/storing of full coverage model data.
- The first step is to select a set of NWP parameters that should be processed. If your office routinely uses a specific set of NWP parameters, it is possible to create predefined sets of NWP parameters for quick selection.

The second step is to select the area that should be covered by the cut-out model data.

The third step is to select the required output the specifications of outputs can be also stored as output definitions.

Operationally, the cut-out data is produced automatically in regular intervals by the Task Editor module.
The module can also be used for automated conversion of WAFC SADIS/WIFS GRIB2 Model to GRIB1 for Legacy Systems.
Modules for Communication
Product Delivery Service
This module is an application called Production Pipeline Editor.This module is used to configure how the text and graphical products created by users or created automatically, should be processed (for example, converted to different formats) and delivered (for example, stored in the database, e-mailed, etc. The following example explains the basic idea: suppose that every day the office is producing a weather situation report, which needs to be:
- inserted into database as plain text
- printed with a nice looking layout to be placed on a notice board
- placed on the office website
- e-mailed as a nice looking PDF to certain customers
- e-mailed and faxed in a simple layout to regional offices during weekdays, and only faxed during weekends

The following pipeline converts the form into all desired output formats and delivers it to all the required destinations.
- The graphical way of editing is easier and more transparent, and it provides a visual overview of the actions that are part of the pipeline. The configuration file required a detailed knowledge of the exact syntax used.
- It enables a specification of more complex deliveries, for example with various conditions and variables.
- Pipelines unify the delivery actions in various applications, because they can be used for processing and delivering map images, messages, tables, etc.
- The module includes tools for immediate display of pipeline status and also for monitoring the pipeline statuses of previous actions.

The basic delivery options are database ingestion, storage to specified directories, FTP, secure file delivery (SFTP, SCP) or WebDAV (HTTP, HTTPS), for special delivery types (sms, e-mail, fax) you need additional modules - see below.
Product Delivery Service – Mail Delivery Module
This module is an extension in the Production Pipeline Editor application.Use this module for the delivery of graphical and text products via e-mail (SMTP protocol).
Product Delivery Service – Moving Weather Fax Delivery Module
This module is an extension in the Production Pipeline Editor application.Use this module for the delivery of graphical and text products via Moving Weather fax channels.
Product Delivery Service – Fax Delivery Module
This module is an extension in the Production Pipeline Editor application.Use this module for the delivery of graphical and text products via an internal fax service.
Product Delivery Service – Enterprise SMS Module
This module is an extension in the Production Pipeline Editor application.Use this module for bulk delivery of SMS messages through SMS gateways using the SMPP v3.4 protocol.
Product Delivery Service – Address Book Module
This module is an extension in the Production Pipeline Editor application.

This module allows to specify contact lists: e-mail addresses, phone numbers, fax numbers, etc. of the recipients of the products. When you specify the recipient in the pipeline, you can simply select the name, without having to recall the e-mail address or the fax number. The recipients can be grouped into various groups: when sending a certain product, you can simply select the given group(s).This module is useful only if you are using the mail, sms and.or fax modules and if you have large base of product recipients.
Product Delivery Service – Custom Delivery Modules
This module is an extension in the Production Pipeline Editor application.Development of custom delivery mechanisms such as non-standard SMS, MMS or SOAP Web Services, voice synthesis and radio broadcasting, TV systems etc., based on your specific requirements.Modules for Web Services
Open GIS Consortium Web Services – Starter edition
This module enables web services in Visual Weather. It consists of embedded HTTP/HTTPS server supporting basic authorization protocol, but also can be facaded by other servers such as Apache to provide numerous web services. The web-server is multithreaded service which is also extensible by user's services (using Python API) and provides standard Web Map Service (WMS) interfaces to Visual Weather mapping subsystem & Web Coverage Service (WCS) interfaces to NWP fields & Web Feature Service (WFS) interfaces to observations & Joint METOC Broker Language (JMBL).
Web Services module accepts requests over web-connection, and exposes system's charts, gridded data, observations and features using standard OpenGIS Consortium (OGC) family of protocols. This allows easy integration with other tools capable of consuming OGC protocols including GIS tools, air-navigation tools including SWIM-enabled SESAR/NextGen systems, Command & Control defence applications, and others.
The Starter edition is intended for small systems, development or testing environment, since its throughput is limited to utilise up to 2 CPU cores.
Following OpenGIS standard services are implemented:
- OpenGIS Consortium Web Map Service specifications 1.1.0–1.3.0 (OGC 01-047r2 IS, 06-042 IS), including Best Practice for using WMS with TIme-Dependent and Elevation-Dependent data 1.0 (OGC 12-111r1 BP - also known as MetOcean Domain Working Group profile). This provides access configured maps in Visual Weather to be displayed in WMS-enabled tools, such as web map widgets, Google Earth, situation awareness displays, GIS systems, rich internet applications, etc. Visual Weather server renders all charts on the fly dynamically and serves them directly over HTTP/HTTPS connection.
- OpenGIS Consortium Web Coverage Service specifications 1.0.0 (OGC 05-076 IS) provides access to gridded model data in a geospatially referenced grid format. Visual Weather provides on the fly data subsetting and server data as GRIB, NetCDF, GeoTIFF, JSON or KML. This data can be processed by the third-party GIS tools as digital fields and further analytically processed.
- OpenGIS Consortium Web Feature Service (Transactional) specifications 1.0.0–1.1.0 (OGC 02-058 IS, O4-094 IS) provide access to Visual Weather observations and edited meteorological features in GML format.
Open GIS Consortium Web Services – Server edition
This module is an extension of the Open GIS Consortium Web Services – Starter edition. It enables web services to be used for larger-scale server deployments - it is not limited in amount of parallel threads for task execution. In addition to that, it also supports additional scaling features such as tiles for Web Map Service (GTile) that allow caching in the upper thier for use of interactive maps at larger scale such as public map widgets.
Open GIS Consortium Web Services – Web Coverage Service 2.0
This module is an extension of the Open GIS Consortium Web Services – Starter edition. It provides OpenGIS Web Coverage Service 2.0.1 (OGC 09-110r4 IS) with MetOcean Metadata Profile (OGC 15-045r3) supporting specific extensions related to meteorological use-cases such as CoverageCollection for grouping of coverages in metadata description, GetCorridorCoverage for route-based extraction in 4-dimensional weather data (WeatherCube). This MetOcean Profile can be used for exposing gridded forecast data with dynamic subsetting for other GIS, processing and planning systems such as SWIM-enabled platforms.
Open GIS Consortium Web Services – Web Processing Service 1.0
This module is an extension of the Open GIS Consortium Web Services – Starter edition and Python Development API. It provides OpenGIS Web Processing Service 1.0 (OGC 05-007r7 IS) basic service framework. It does not include any readily developed processing services, but allows developing your own services using Python API that can be exposed over WPS. It supports both framework functionality for registering the algorithms, invoking them in both synchronous and asynchronous calls.
Python Development API
This is underpinning capability of Visual Weather, this option allows you to access API of core functions of software from Python. This will allow you to create your own extensions to a software, create data decoding drivers, perform own computations on data, derive other fields, create own visualizations, generate own custom products, provide custom web services, and so on.
Visual Weather contains integrated Python engine wrapper, and extensive set of objects for accessing database, UI, rendering and other parts of the package. This way it is possible to create meteorological tools on top of Visual Weather, by utilizing existing core functionality - and therefore allowing you to focus on business logic, leveraging existing database, decoding toolkit, formatting tools, UI integration and dissemination capabilities.
By utilizing this option, Visual Weather essentially becomes and application platform for creating your own tools in Python on top. API provide extensive possibilities, and therefore it is highly recommended to order it together with Python API training, to gain experience in interfacing IBL’s functions.This option also includes including 20 hours of developer-to-developer support.
OLE2 Map Linking
This module is a special export functionality in Map Editor.Use this module if you have some documents created in in MS Word, MS PowerPoint or Open Office to which contain maps and the maps should be automatically updated when you open the document: this functions in a way that the “image” of the map that is copy/pasted from Map Editor to the document, is not an image but a link to the actual map and the link is updated to show valid data.

Privacy Overview
This website uses cookies to improve your experience while you navigate through the website. Out of these, the cookies that are categorized as necessary are stored on your browser as they are essential for the working of basic functionalities of the website. We also use third-party cookies that help us analyze and understand how you use this website. These cookies will be stored in your browser only with your consent. You also have the option to opt-out of these cookies. But opting out of some of these cookies may affect your browsing experience.
Powered by 